Wednesday 9 March 2016

Vancouver GIS User Group - presentation

Please see the link to download slides from the Vancouver GIS User Group: March 9th, 2016. 
https://github.com/mattjbayly/VancouverGISUserGroupPres/tree/master/Git
Title: The Art and Science of Habitat Suitability Modelling Occurrences, Physiology and demography. 

Friday 10 July 2015

Rare long distance dispersal and dispersal limitation?

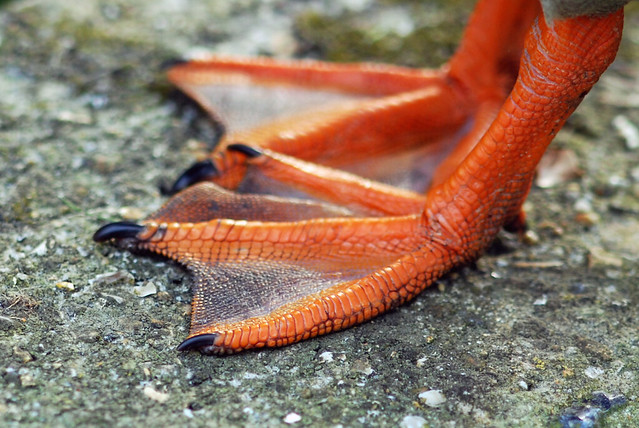
I remember once seeing a large collection of dried fruits and seeds on display along with some other art in a local cafe. It was clear that an avid naturalist had collected each of the specimens on local hikes & related outings. Immediately to any observer we think of diversity of form and therefore diversity of function. This display case held a variety of long winged maple fruits, some asters with dandelion-like tufts, nuts, burrs with hooks and barbs, long legume pods as well as many others. Each of these dry fruit types are admired by botanists and well described with a long list of associated nomenclature. But there was another major category that for some reason was absent from this display case and is rarely discussed. A category that is highly prevalent in nature across species, but lacks any sophisticated adaptations for dispersal. What I am talking about is the visually unappealing, non-specialised fruits (usually capsules) full small seeds with no obvious features for dispersal. We refer these fruit types as non-assisted in terms of their dispersal mechanism, meaning they drop to the ground and then potentially are dispersed by run-off or related means. What is most amazing is that at the landscape or regional scale a large majority of these small herbs and other plants with non-assisted dispersal mechanisms still manage to migrate and disperse to suitable habitats just as effectively as other species with specialized structures for wind, water or animal-mediated dispersal. In other words, species that seem to have sophisticated structures for dispersal don't necessarily have larger range sizes (Thompson et al 1999: J. Ecol. 87). The prevalence and colonization ability of plants with non-assisted dispersal mechanisms may seem counter-intuitive, but this leave us asking what can fruit and seed morphology tell us about a species dispersal ability and the potential for range shifts with climate change? How do these rare long distance dispersal event happen? What sort of time period constitutes these 'rare events'? To make things even more confusing, it is also argued even for species with sophisticated structures for dispersal, nonstandard events (e.g. seeds being stuck to the bottom of waterfowl feet) are still usually responsible for long-distance dispersal (Higgins et al. 2003: Ecol . 84).

So how do we understand these events, can we ever get at the mechanism of dispersal limitation for a species? These events are almost impossible to study, even with the use of genetic tools it is difficult to tell whether an individual at location X got there through conventional means, some non-standard dispersal event or whether pollen from a far away population was just introduced from birds/insects. For Mimulus cardinalis its interesting to think of all the possible means by which it could possibly disperse across drainage basins or upstream:
- Gusts of wind might be able to push seeds of the plant a few meters upstream.
- Maybe seeds get caught in deer fur as they are browsing plants
- Mergansers, mallards, Canada geese and other waterfowl are often seen resting in patched of M. cardinalis so perhaps seeds are incidentally stick to their feet and feathers.
- Dead foliage with seeds might be as nesting material for riparian species (waterfowl, muscrats, dippers ect).



Tuesday 31 March 2015

R - Maps and Spatial Data Workshop

Tutorial for working with maps and spatial data in R.

Content:
1. Get digital elevation model of a region, download as tiles and then paste together
2. Get shapefiles of political boarders & other features to add to the map
3. Add a compass rose
4. Simple Plot: convert DEM to fancy hillshade map & plot
5. Adding points to a map (sites, species ect)
6. Raster manipulations (raster calculator)
7. Polygon manipulation
8. Working with projections 
9. Add map insert (little overview map)

Tutorial R script - from Google drive
Tutorial R script - from Dropbox


Thursday 12 February 2015

Where to get good climate raster grids?

The following is a list of possible data sources for climate raster grids. All sources should work well & give the same overall picture (usually)

4th Place: WorldClim 
  • Pros: easy to use; resolution ~ 1km; global coverage; most widely used & therefore limitations recognized/known.
  • Cons: Some more regional sources below are thought have greater accuracy (more local weather stations). 
3rd Place: PRISM Climate Group 
  • Pros: easy to use; resolution ~ 800m; well trusted & used by big gov agencies USGS, NOAA ect; multiple time periods available; custom orders possible for time periods, resolutions & unique variables; LIVE climate data. 
  • Cons: USA only; basic data free, but have to pay for special custom orders.
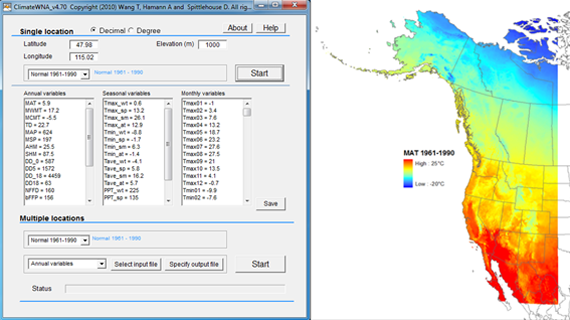
2nd Place: ClimateWNA ready from UofA Hamann's lab webpage
  • Pros: easy to use; high resolution ~ 1km; all benefits of ClimateWNA (see associated documents). 
  • Cons: Projected as LCC & have to reproject data; one time period; 1km res might be problematic in steep terrain? 
1st Place: ClimateWNA (desktop version) 
  • Pros: Its also possible with ClimateWNA to produce climate raster grids by sending the program DEMs as a text file to make any climate variable at any resolution in North America.
  • Cons: Up to the user to decide appropriate resolution (e.g. climate grids generated at 5m resolution give false precision and are not necessarily more accurate). 


Sunday 8 February 2015

The Klamath Region

The Klamath region (or Klamath Mountain Range) is located between southern Oregon & northern California. It connects the Sierras to the Cascades and joins the southern Coast range to the northern Coastal mountains. Geologically the Klamath Range is well known for its complexity. Ecologically it represents an important biographic region of high turnover, where many species reach their northern range limits. The Klamath Mountains are essentially the northern range limit of the California Floristic Province. Mimulus cardinalis (the scarlet moneyflower) is also in this pool of species & reaches its northern range limit in south/central Oregon (see figure - modified from original on Bonap).

Why do so many species reach their range limits at the margins of this ecoregion? Is this high turnover a result of climatic constraints (niche driven range limits), legacies of glacial refugia (dispersal limitation) or perhaps the high topographic & bioclimatic complexity creates suitable microsites allowing for small pockets of populations from southern populations to occupy this area. Of course combinations of these factors along with other mechanisms may be responsible for this tension zone. Over large regions, richness is expected to increase with the geological age of the landscape (more time for speciation - Whittaker (1961)). The challenge is decoupling these processes when transplant studies within and beyond the range cannot be carried out for each species.

The shared range limit for many species in the California Floristic Province and the underlying climatic gradient over the Klamath tension zone suggests climate is the predominant factor limiting these species distributions, but how many are limited by dispersal? Can we make climate change projections for the California Floristic Province as a whole? Will the ecological and topographic complexity of the Klamath region facilitate are restrict the northward migration of species with climate change?


Saturday 7 February 2015

SMAP: Global Soil Moisture Mission

Looking for the perfect soil moisture raster GIS layer? The SMAP project stands for Soil Moisture Active/Passive. This satellite will produce global maps of soil moisture spatial data within the top 5 cm of soil, rather than deriving this data from precipitation and temp data. This satellite will also show specific dates & duration of freeze thaw cycles (a dream for niche modelling of many plants). Launched January 31st 2015, data will probably not be available for some time, but still something to get excited about.
more info here.